We can have many opinions about our company or product as well as information about our users at our fingertips. Below I have created a short list of tools and places on the Internet where we can find them.
Before embarking on a project, we should learn as much as possible about the needs and problems of our users. It is worth using free-of-charge resources for this purpose. While the information gathered in this way is no substitute for user research, it will give us a good basis for forming our first hypotheses. In the article I describe where to get valuable information and how to obtain it.
Let's start with the tools.
Before we go on surfing the Internet in search of data, it's worth mentioning the tools that help us get the information we need faster. The choice is huge and I decided to divide them into two types:
Programs monitoring user activity on the Internet.
Tools to collect information directly from users.
Programs monitoring activity on the Internet.
One of the most popular Polish programs for web monitoring is BRAND24. There are also many foreign programs available such as Hootsuite and Brandwatch. All of the programs mentioned above monitor social media channels such as Facebook or Twitter for us in search of mentions of our brand. The tools also allow us to actively search the entries by the phrases or combinations of phrases we have typed. Owing to this, in an instant we receive a list of entries in which the keywords we have entered appeared. Moreover, most of the programs of this type allow us to calculate the indicators we are interested in, an example of which can be Influencer Score, which evaluates the effectiveness and reach of the person who created a post e.g. about our brand.
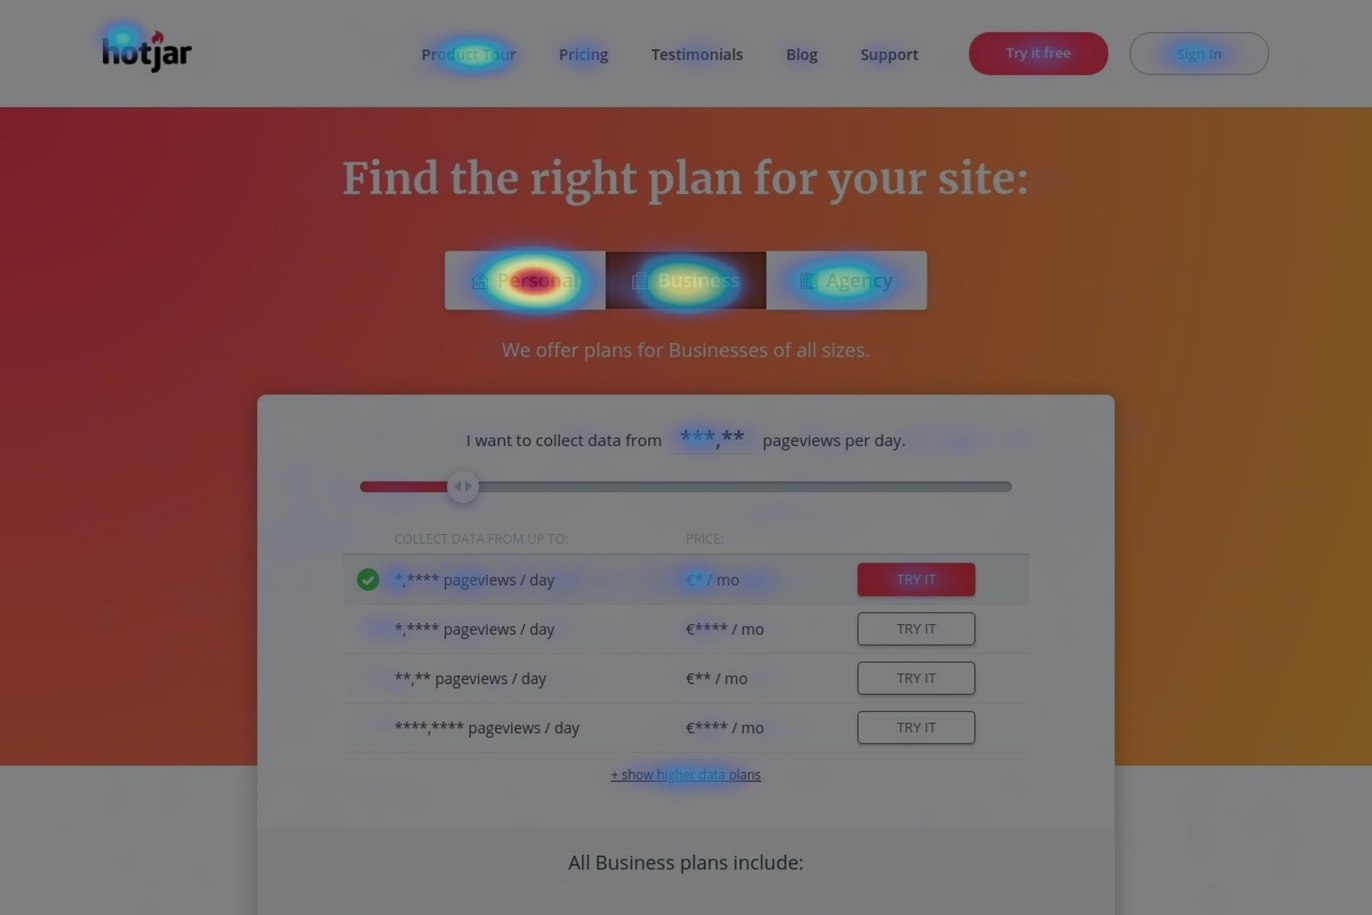
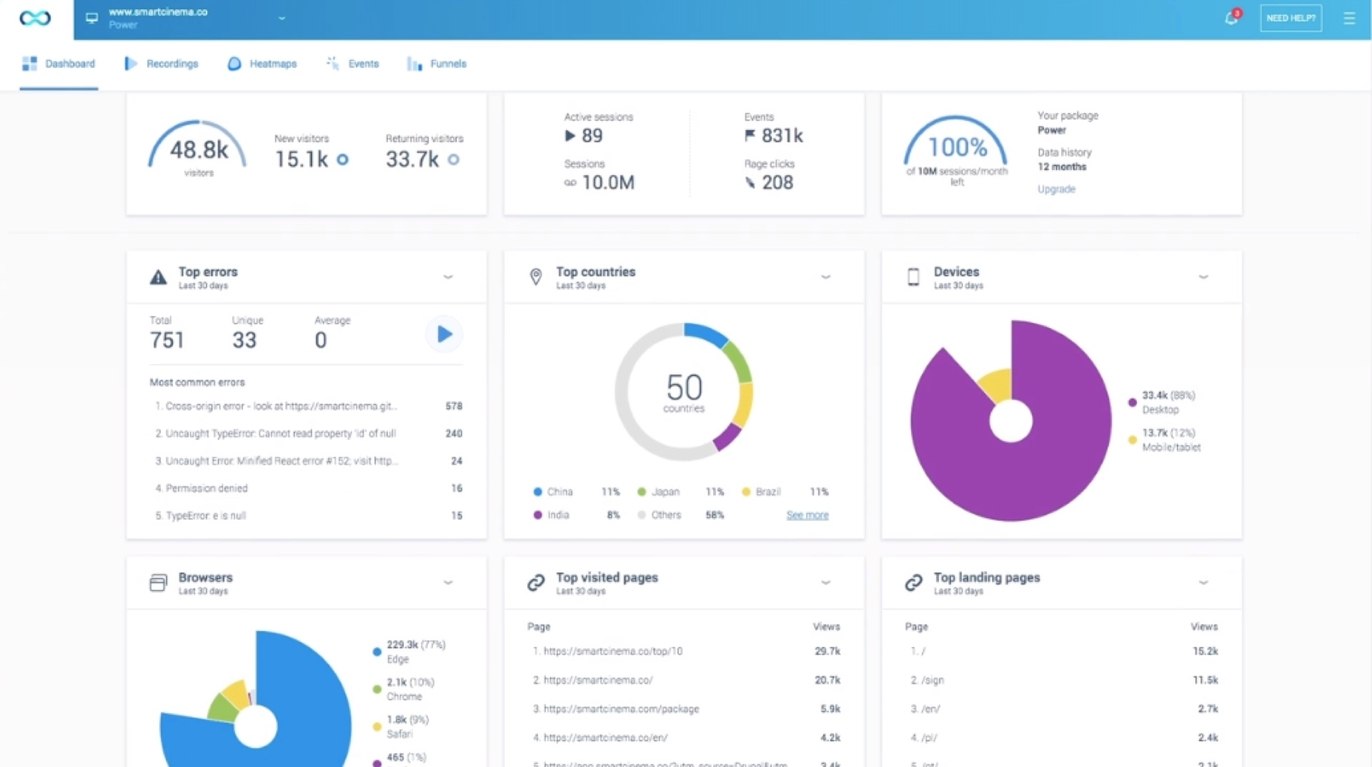
When it comes to programs that monitor websites and applications, some of the most popular are HotJar (for websites) and Smartlook (for websites and applications). The mentioned programs are able, among other things, to record anonymous user sessions or create heat maps, thanks to which we will find out what attracted the users' attention most. Some programs of this type also have the ability to place a survey with questions for users on any page. This is a great way to measure customer satisfaction with the processes of our interest, e.g. shopping in an online store. You don't need to be a programmer to use these tools: connecting the tool to your site is a matter of simple copy/paste of the code generated by such programs. In addition, the data are always presented in an accessible, understandable way.
An example of a click map on a website. Source: hotjar.com
The last website monitoring program I would like to mention is Google Analytics. This popular program allows us to collect important quantitative data such as:
the amount of interaction on a website,
the average time spent on the website
bounce rate – i.e. the indicator of the number of people who have left the site without moving to another sub-site
the number of returning users,
the lead generation costs,
the user path map,
demographic data (age, approximate location, etc.)
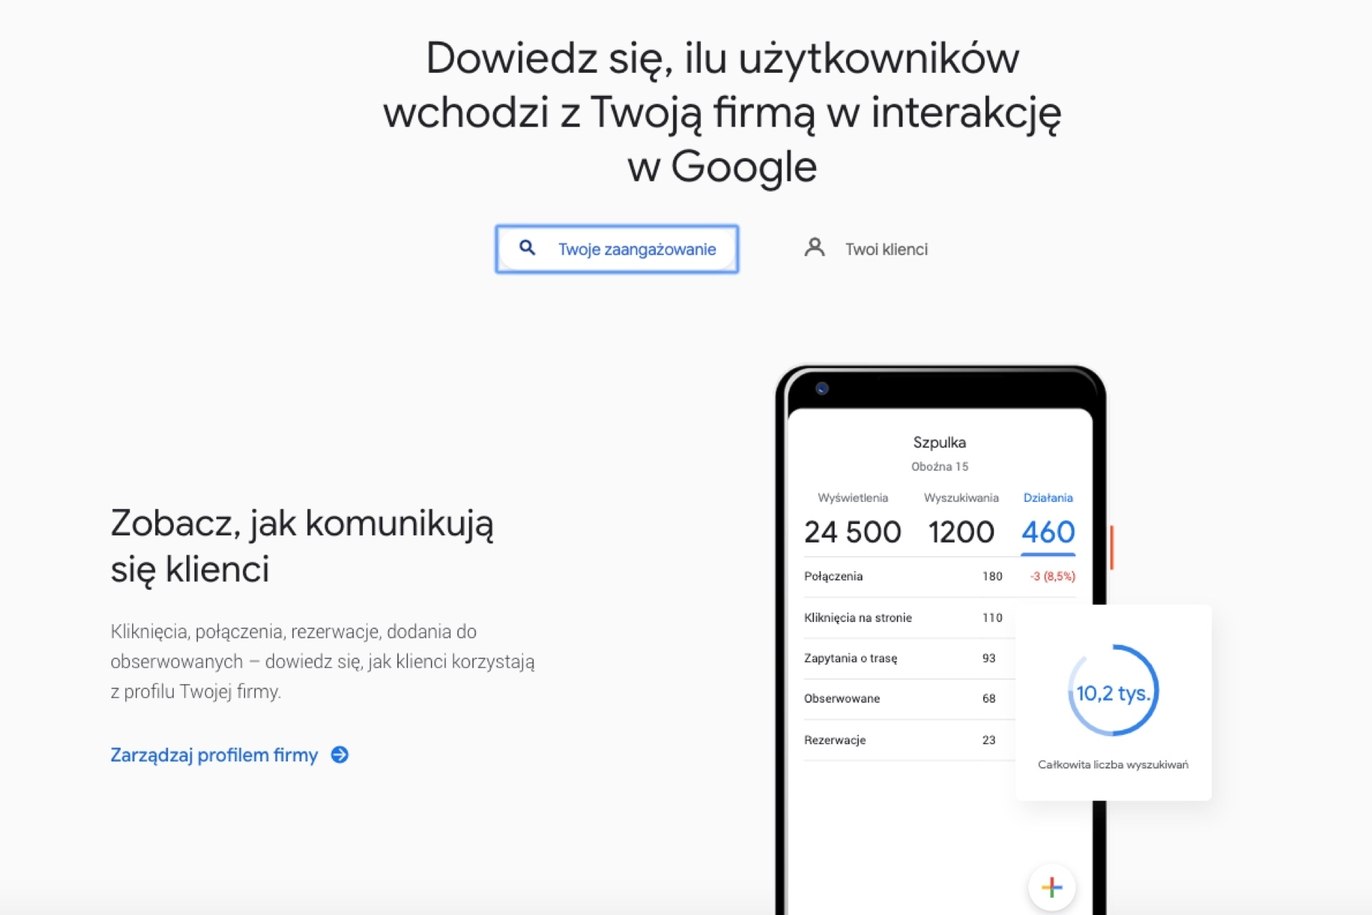
When writing about Google, we can't forget about Google My Business, which is a free tool to promote your business profile in Google search and Google maps. Among other things, the program allows you to quickly view the number of visits to the site and the total number of searches.
Tools that collect user feedback.
These are all programs that allow us to actively collect data directly from our users at a relatively low cost. We have at our disposal both simple satisfaction surveys as well as more advanced programs that enable remote usability tests. However, we should start with surveys which are the simplest ones.
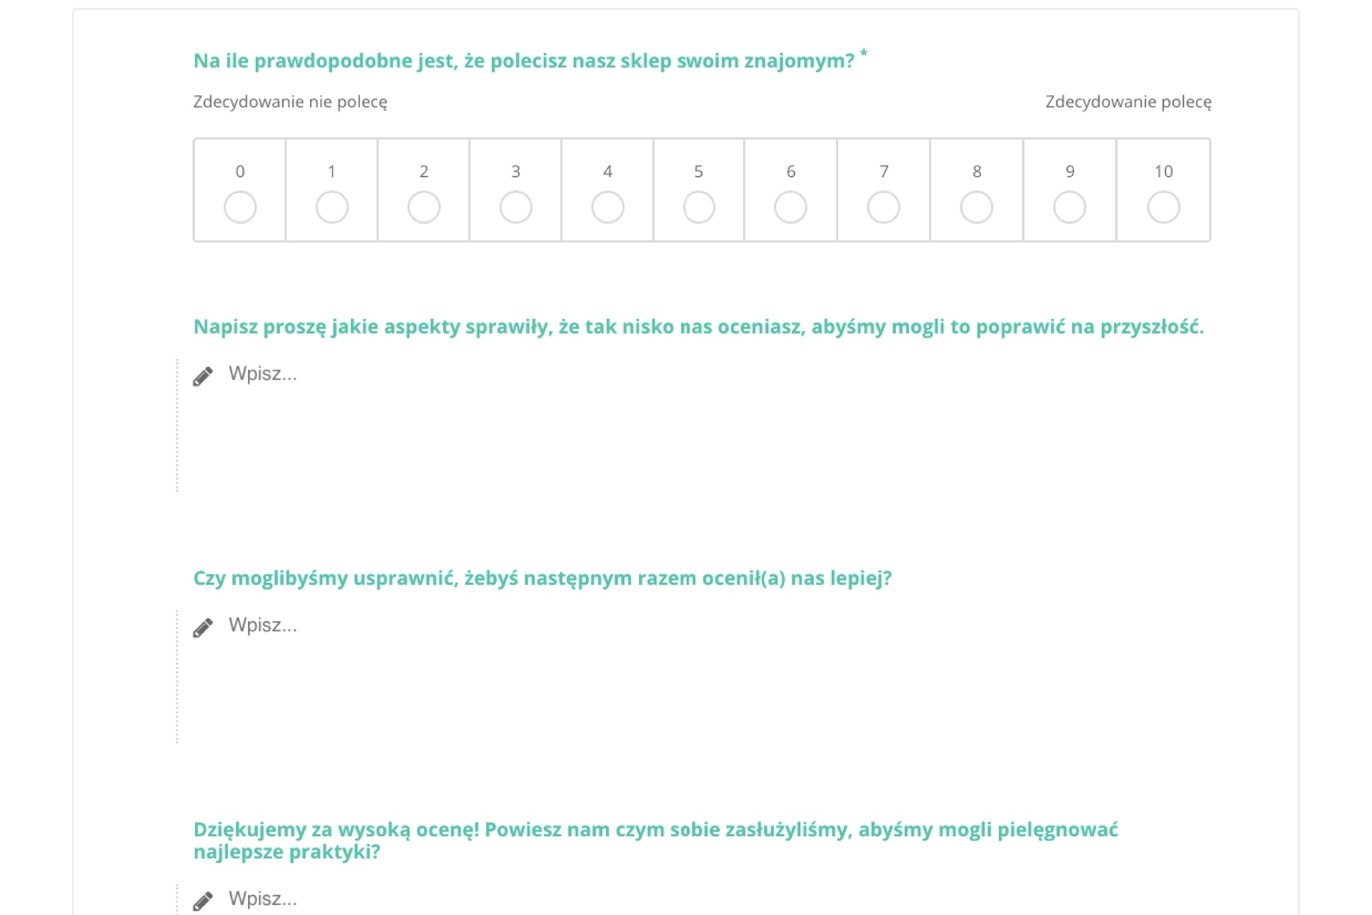
Surveys can be quick and inexpensive. The most important aspect here is good question planning and selection. Programs that will allow us to create online surveys include, among others, SurveyMonkey, Typeform, Google Forms and WebAnkieta (a web-based survey program). All of those listed also provide templates along with sample questions to help us create our first form.
źródło: webankieta.pl
More advanced programs create remote usability tests of websites, applications, prototypes or mockups possible. The most popular are Usability Hub, VWO, UserTesting and Loop11. Additionally, for some programs we don't need to prepare extensive prototypes for testing; we can also conduct tests in the early design phase e.g. through preference tests, 5-second tests and card sorting. Moreover, some of them have their own user databases, which makes the whole testing process much easier.
Let's go to our sources
Although tools often come in handy, they are not essential. Sometimes the source itself provides analytical tools. Below I describe all the places you should look at in order to get information about our company.
Discussion forums and online stores.
Discussion forums most often describe problems that occurred while using our product or mention requests for new features. Very often we can find interesting ideas and opinions on topics that interest us there. Such companies as: Spotify and Orange Polska have long had discussion forums with separate sections for their customers' ideas. From among the most active forum users we can also select people to cooperate with us on improving our products, e.g. for usability tests or interviews.
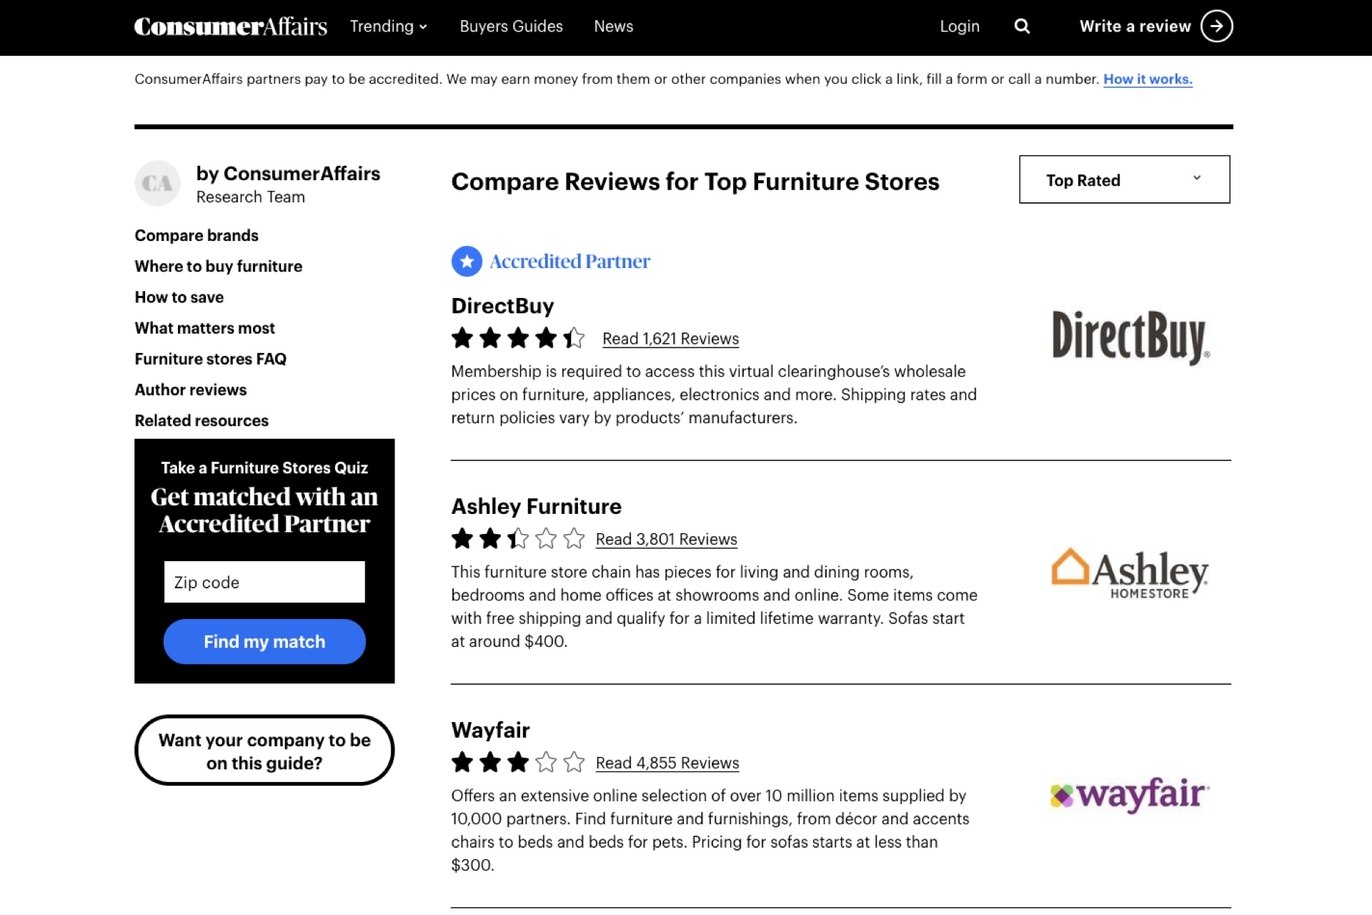
Worth mentioning is that in order to obtain opinions of our interest we do not have to create our own forum: information can also be found on existing forums. The biggest sites collecting people's opinions currently in the world are: Reddit, Quora, Amazon, consumeraffairs.com. Of course, Google comes to the rescue: sometimes, to find opinions about our product, you just need to type its name. As far as Poland is concerned, the most popular opinion-forming forums are: opiniuj.pl, komorkomat.pl (for telecommunication industry), opinie24.pl, zapytaj.onet.pl, forum gazeta.pl and Wykop.pl.
Social media.
Facebook, Instagram, LinkedIn, Twitter and many more. Depending on who our customers are, we should follow appropriate social media channels. Fortunately, thanks to the tags used on many of them (such as "#" on Instagram) or monitoring software, we can quickly find posts about our brand. If we have a company profile, it is also worth reviewing the accounts of our fans, so we can better understand who they are, what their needs are and what their opinion is about our brand.
From this data, you can then create proto-personas, which are very preliminary user profiles that represent different groups of recipients of our product. Let's keep in mind, however, that such proto-personas should be detailed as the personas are discovered. Before creating a proto-persona, it's also a good idea to look at our company profile analytics tab (almost every social media channel has one for your company account). Often we will learn from such analysis, among other things, what time of day is the best for us to make a publication and which age group is most active on our profile.
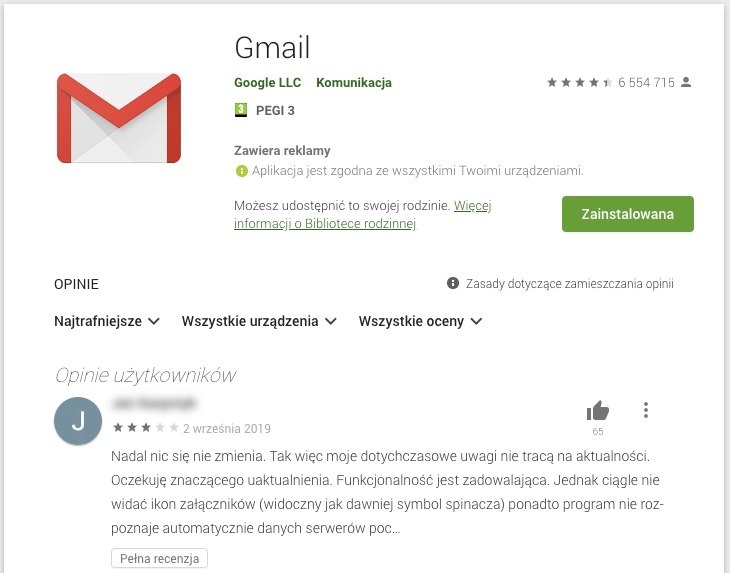
Comments on Google Play/App Store.
Another repository of knowledge is the comments section and application ratings on Google Play or the App Store. On both platforms we have the ability to filter comments (e.g. by app version or ratings). Many users like to use this channel to communicate with our brand. Just let us remember not to generalize your recipient community based on comments posted online – usually people will make the effort to write a comment when something annoys them deeply or, alternately, delights them. Extreme evaluations are normal in this case. This does not change the fact that very often, even behind a very negative user review, there are a lot of interesting conclusions. Google Play also gives users the ability to “boost” interest in the issues described in the comments. This will help us learn which errors potentially occur more often than others or generate more frustration.
A screenshot from the Google Play platform. At the bottom of the screen, we see user comments.
Colleagues at work.
Colleagues at work are often an underestimated source of knowledge about our product. Especially those working directly with the customer such as the helpdesk department or front desk. They are the ones who talk to customers and try to solve their problems. In the case of a smaller company, where we do not have such extensive structures, conducting informal interviews with employees is worthwhile - they will get the feeling that someone is listening to them, and we will gain a different perspective on our product. However, if your company has many employees, you might want to think about a survey (such as Google Forms). On the other hand, we should remember not to make the survey too long and to keep the respondents anonymous, thanks to which we will have a greater chance of obtaining more honest answers.
Informal usability testing with employees is also worth considering. For this purpose, the tools listed at the beginning of this article in the section “programs that collect user feedback” will be useful. It is good if such tests take place with employees of departments that do not deal directly with product development, e.g. accounting or HR departments.
Website or app traffic
It is about any scripts that collect anonymous information about our users. If we have e.g. Google Analytics, before we go on to analyze the data, it is worth checking whether the program collects real data, e.g. thanks to a plug-in for Chrome browser – Tag Assistant. It's also a good idea to supplement data with HotJar or Smartlook heat maps. Google Analytics will provide us with quantitative data and HotJar or Smartlook will record, in the form of a video, our users' sessions and create heat maps, while maintaining (in accordance with the GDPR) their full anonymity.
Publications posted on the Internet are often the first sites we go to when looking for statistics about our recipient group. Whenever reviewing this type of publication, it is always a good idea to pay attention to their source. I have described a summary of the most popular sources below.
Renowned research institutions
At the Polish Statistics (GUS) and Eurostat websites we will usually find the data on macroeconomic phenomena, such as the number of people with Internet access in Poland, the value of the Internet market in the EU, etc. It is worth adding that the GUS website offers the possibility of ordering more detailed data. Both institutions – GUS and Eurostat – also prepare publications and infographics to present “raw” data in a more accessible way.
The following institutions are: Biostat, Statista, Gemius and Statcounter. These are private research institutions. As with public institutions, we have a choice between free reports and publications and the option to order more detailed research. These webpages are worth looking at at the end or at the beginning of the year. This is often when the biggest reports are released that summarize the year or set forth predictions on the coming year.
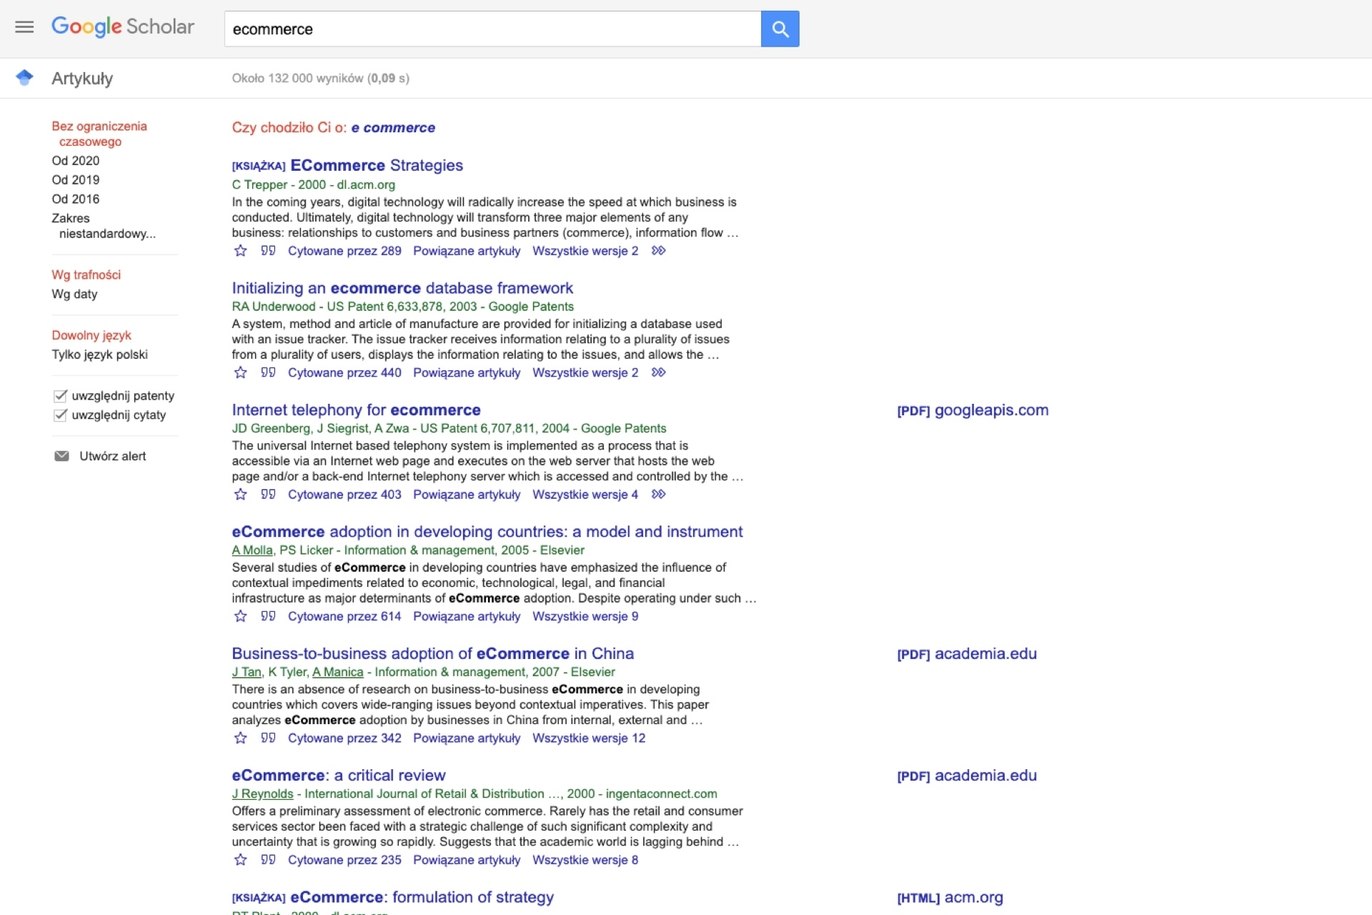
Google Scholar
Another great tool from Google in this article. In a nutshell, it can be described as a separate Google search engine, which will pick up scientific publications available on the web for us. The search engine also provides many useful tools such as searching for publications in a particular language, saving them to your Google account to read “at a later time” and advanced searching giving the possibility to apply a filter e.g. showing only papers published in a particular scientific journal or on a particular website.
Google Scholar
To sum up
We can find a lot of interesting information and opinions for free or for relatively low cost on the internet. While the sources described above are no substitute for contact with real users, they will allow us to better understand the problems and needs of our users. Starting a project with this information, we are more likely to make the entire project successful.
K2 Digital Products.
02.12.2020.
Mateusz Jędraszczyk
Product Designer
Product Designer z zamiłowania i zawodu. Stara się łączyć świat biznesu i użytkownika w jeden spójny produkt lub usługę.